

The data about one asset lives in six places. Nobody bought the layer between them.
The PMS holds the rent roll. Accounting holds the ledger, and it does not agree. The CRM holds the pipeline, the maintenance queue holds work orders keyed to nothing, the leases are scans in a folder — and the number the owner actually asked for is in a spreadsheet somebody rebuilds by hand every month. Nobody bought a bad system; every one of them is good at its own job. We build the two things nobody sold you: the integration layer that makes the same number mean the same thing everywhere, and the AI layer that reads the documents nobody has time to read.
We run it as a Portfolio Data Audit: we map how data moves between your PMS, your accounting package, your leasing system and your maintenance queue today, and mark every point where a human is doing the translation. You keep a one-page diagram of your own data flow — that diagram is the offer, the call is just how it gets delivered. No slides, no follow-up sequence.
Written for operators, not for a pitch deck
Scope
- Owner-operators and property management companies running roughly 500–20,000 residential units, or a commercial portfolio of comparable size.
- Brokerages and investment sales shops whose pipeline, client records and commission splits are spread across a CRM, a shared drive and one person’s spreadsheet.
- Workplace, facilities and corporate real estate teams holding sensor data they cannot turn into a decision.
- PropTech companies past seed with a product in market, needing senior capacity for a twelve-week problem rather than a permanent hire.
Institutional funds with an in-house engineering division. You already have the team this page is offering, and you will get more from your own roadmap than from us.
Big enough that the rent roll no longer fits in one person’s head, small enough that nobody has an internal platform team — that is the shape where this work pays for itself.
Every one of these builds started at a table like this one, with an operator describing the month-end they had just survived.
Six scenes from a month you have already lived
Observed conditions
“Which leases have an option to renew in Q3?”
The honest answer is that somebody will read PDFs for a week to find out. The notice windows are in the leases, the leases are scans, and the abstract spreadsheet was last fully trusted two acquisitions ago.
The PMS and the accounting package disagree, and close absorbs the difference
Two systems, two versions of the same month, and one person who knows which to believe for which line. The fix is the same manual reconciliation every time, and nobody has an hour to write it down.
Three audiences, one set of numbers, three different spreadsheets
The owner wants NOI and variance to budget. The manager wants delinquency and open work orders. The tenant wants their own ledger and nothing else. Each gets a hand-built export.
CAM reconciliation by hand, then disputed by the tenant
Pro-rata share, exclusions, caps, gross-up — all in the lease, none of it in the system, all of it reassembled in Excel each year. Then the tenant’s asset manager asks for the backup.
A maintenance queue with no relationship to the asset record
Work orders arrive by email, phone and portal, land in a queue keyed to nothing, and never make it back to the unit history.
Sensors are recording; nobody is deciding
Desk sensors, badge readers, room panels, the BMS — all producing data, all feeding a dashboard nobody opens.
One source of truth projected three ways — owner, manager, tenant — without three different versions of the truth appearing behind them.
What is hiding inside each floor’s lease
Stacking plan — illustrative
A building, drawn as its tenancies. Select a floor to see what the lease says about it — area, expiry, next escalation, and the notice window that decides whether you get to reset the rate. Floors whose notice window falls inside the next two quarters are marked. Every one of these fields exists today; it is just sitting in a PDF.
This is the argument in one picture: the information is per-floor, it is operational, and today answering “which notice windows land in Q3” means somebody reads the files. Lease abstraction turns this drawing into a query.

The asset is physical. The data about it should still agree.
Four corners of the same industry
Delivered work
One portfolio, projected three ways without three truths
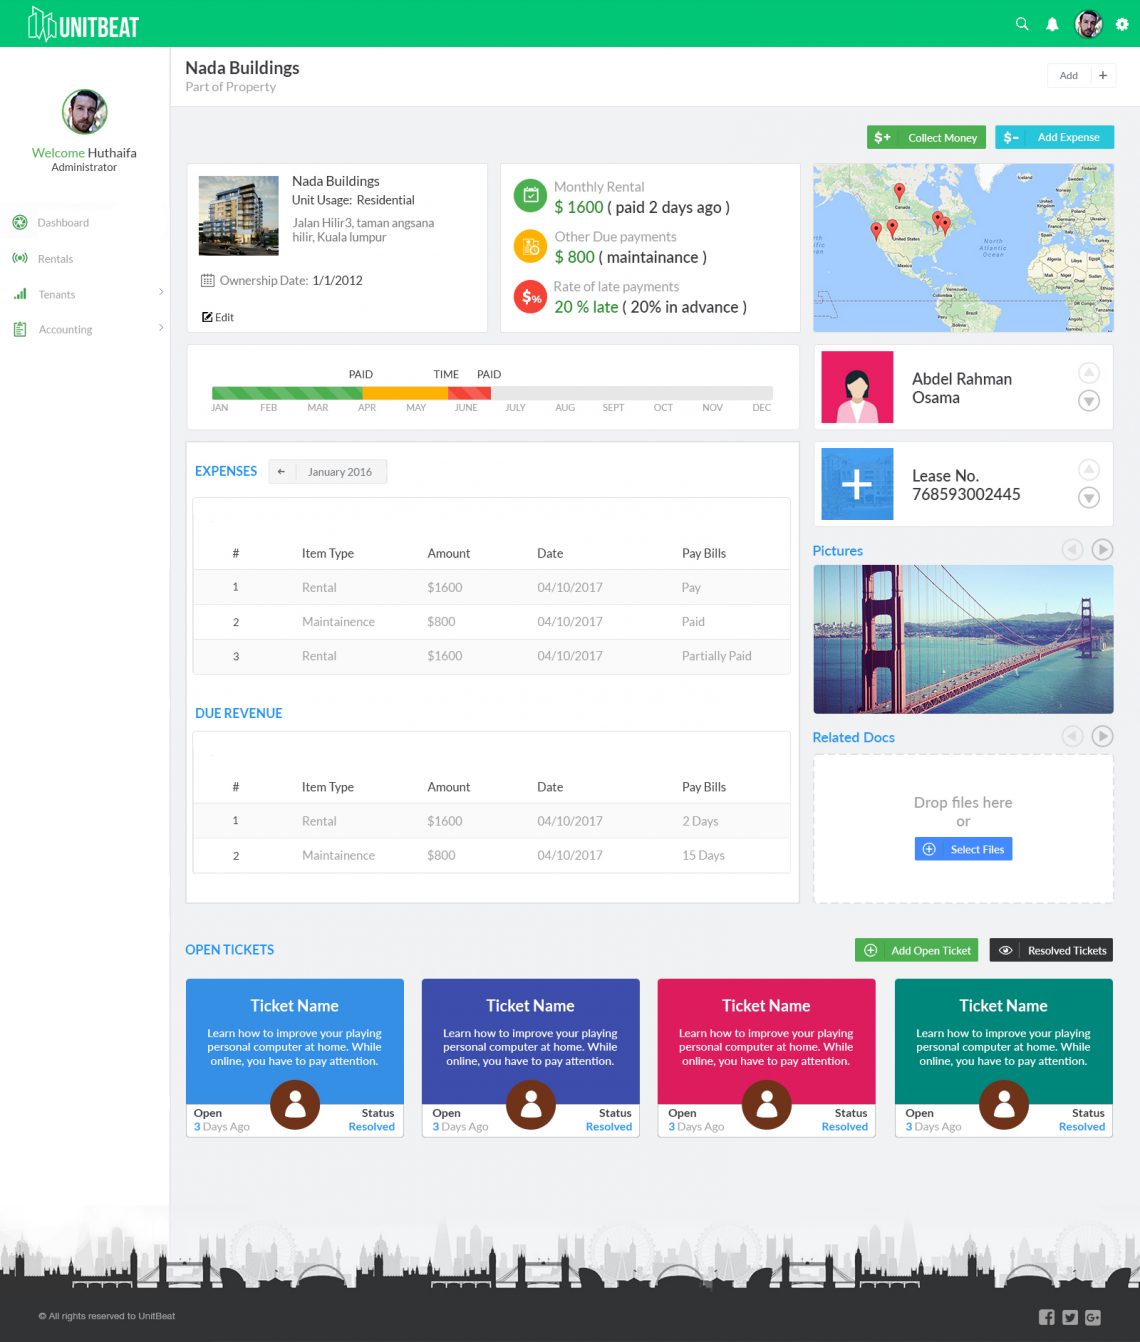
Owners, property managers and tenants each get their own view of the same underlying portfolio data — analytics, leasing and payments. The hard part was never the screens: it was the permission and data model underneath them, so that one source of truth can be projected three different ways without three different versions appearing. Shipped as a working multi-tenant platform with role-scoped analytics, leasing workflow and payment handling.
Footfall and catchment, privacy-safe at volume
Anonymised mobile data turned into footfall and demographic insight for site selection and catchment analysis. The hard part was doing it privacy-safely at volume: aggregation and anonymisation that hold up to scrutiny, over a pipeline large enough that naive processing is not an option.
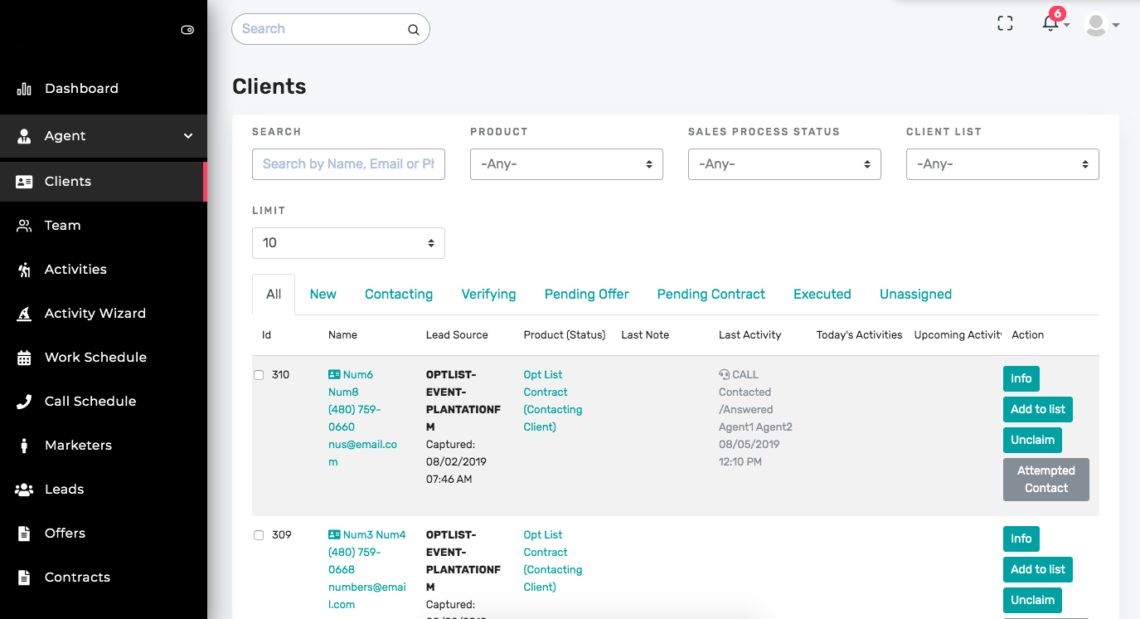
A back-office shaped to how the firm actually works
Client and deal management, role-based access across the firm, and integrations with the third-party services the brokerage already depended on. The hard part was fitting the software to this brokerage rather than forcing a generic CRM’s model onto it, while keeping access boundaries clean between roles.
From a sensor stream to a booking somebody trusts
Desk, room and locker booking driven by live IoT occupancy data. The hard part was the gap between a sensor stream and a usable booking experience: reconciling what the sensors say a space is doing with what the booking system believes, in real time, on a phone.
Portfolio and tenant operations, location analytics, brokerage back-office, workplace occupancy. Four different corners of this sector — and one team shipped all four because underneath they are the same problem: data about a physical asset, scattered across systems that were never designed to talk to each other.
Same Portfolio Data Audit, your systems: where the numbers diverge, and who is translating between them by hand.
What we build, and what you hold afterwards
Schedule of works
Timelines are honest ranges and move with scope. Every one of these ends in an artefact you keep — a data map, a queryable database, an accuracy report — not a capability you were told about.
Portfolio data layer
One place where the rent roll, the ledger, the leasing pipeline and the maintenance queue agree. Connectors into the PMS, the accounting package and the leasing system — Yardi, MRI, RealPage, Entrata, AppFolio, Buildium, VTS, whatever you actually run — a canonical asset and unit model, and reconciliation that surfaces disagreements instead of hiding them.
You get: a live synchronised data layer plus a written map of every field and where it came from. API integrations →
Lease and document intelligence
Scanned leases, amendments and estoppels read by an LLM pipeline into structured records: parties, dates, rent steps and escalations, options and notice windows, CAM treatment, clause references. Every extracted field links back to the page it came from, and low-confidence extractions go to a human review queue rather than silently into the database.
You get: a queryable lease database, a critical-date calendar, and an accuracy report measured on your own documents. AI integration →
Multi-role portals
Owner, manager and tenant views over one set of numbers, with the permission model designed before the screens — the UnitBeat pattern.
You get: a portal your owners log into instead of asking you for the spreadsheet. UnitBeat case →
Brokerage ERP and workflow
Deal pipeline, client records, commissions, documents and role-based access, shaped to how your firm works and integrated with the services you already pay for.
You get: a back-office system with one record per deal. MadValorem case →
Location and footfall analytics
Catchment and isochrone analysis, trade-area overlap and footfall trends for site selection and asset positioning — built on privacy-safe aggregated data with the consent and anonymisation position documented rather than assumed.
You get: an analysis tool your acquisitions team runs themselves. Location intelligence case →
IoT and occupancy integration
Sensors, BMS and BACnet points and booking systems joined into one utilisation picture at floor and desk level — with the numbers a lease decision actually needs.
You get: utilisation reporting tied to leased area, not a dashboard of raw counts. Smart-workspace case →
Natural-language analytics over your portfolio
Ask “which units rolled to market rent below budget last quarter” in English and get the query, the answer and the rows behind it. Built on top of the data layer — never as a standalone toy.
You get: a query surface your team uses without waiting on an analyst. AI assistants & RAG →
Fitted to how this brokerage actually works rather than forcing a generic CRM’s model onto it — with access boundaries kept clean between roles.
Portfolios, leases and listings are abstractions until you stand in the street they price. The software has to hold up at that scale.
What you’re thinking, and the straight answer
Queries raised
Sceptical about AI near your lease files? Good.
Drawing LA-12
Lease abstraction: 12 questions to ask before you let an AI near your lease files
Extraction demos run on clean leases with no amendments. Your files are photocopies of faxes with a rider stapled to the back. These are the twelve questions that separate a tool which survives your actual documents from one that produces a spreadsheet of confident, wrong dates — with a column to write each vendor’s answer in. Sheet 4 is us answering them about ourselves.
The diagram is the offer. The call is how it gets delivered.
Portfolio data audit
Thirty minutes. We map how data moves between your PMS, your accounting package, your leasing system and your maintenance queue today, and mark every point where a person is doing the translation by hand. You keep the one-page diagram of your own data flow whether or not we ever work together.
- No slides and no pitch — one call
- An engineer on the call, not a salesperson
- There is no follow-up sequence